This demo is for research & educational use only — not a medical device. Read full disclaimer.

AI-Based Cell and Grain Size Analysis

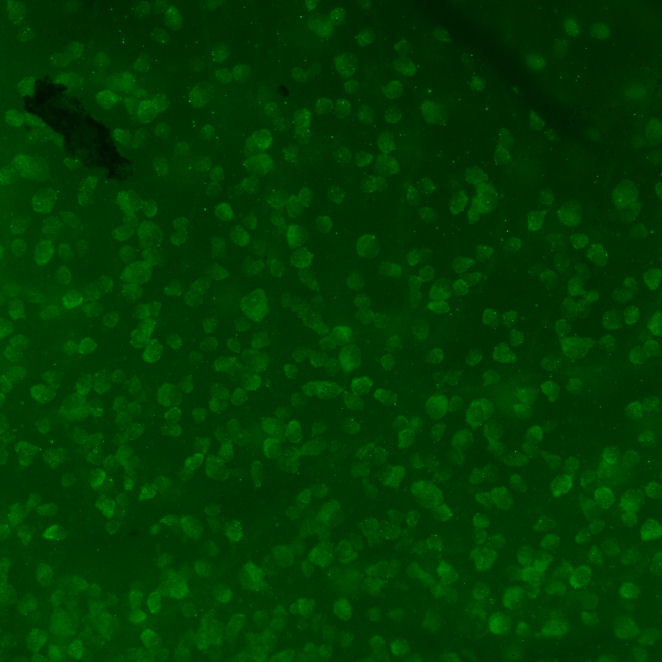
Biological / Cell Images

Suitable for fluorescence microscopy or similar images with visible cell bodies, nuclei, or cell-like structures.

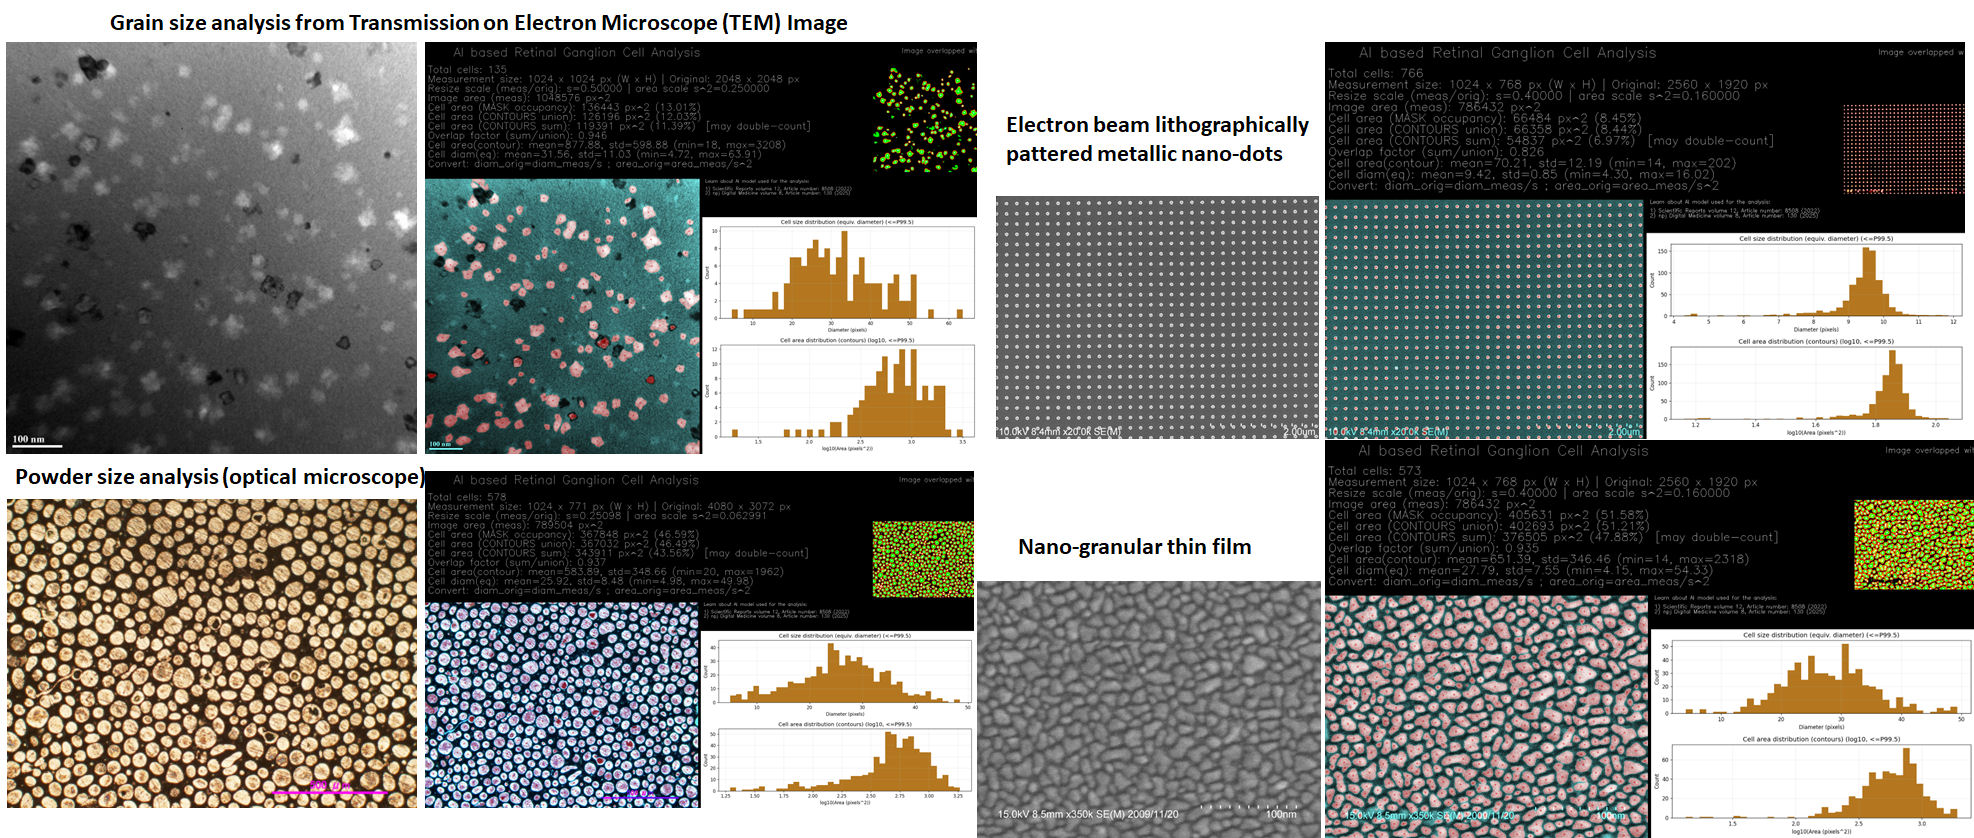
Materials / Grain Images

Suitable for SEM, TEM, metallography, powders, grains, particles, and other microstructure-style imagery.
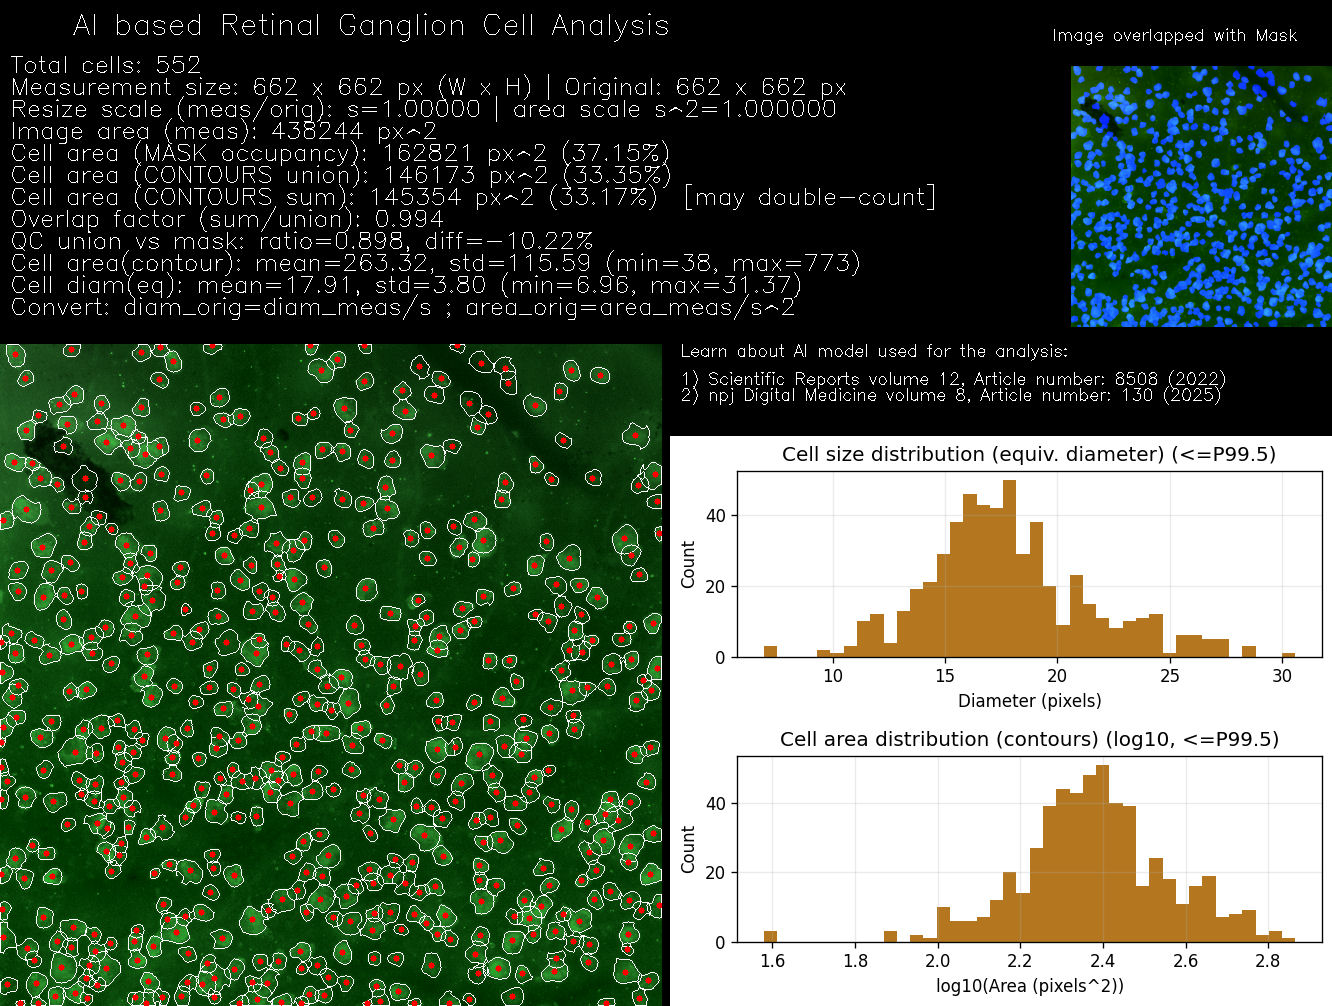
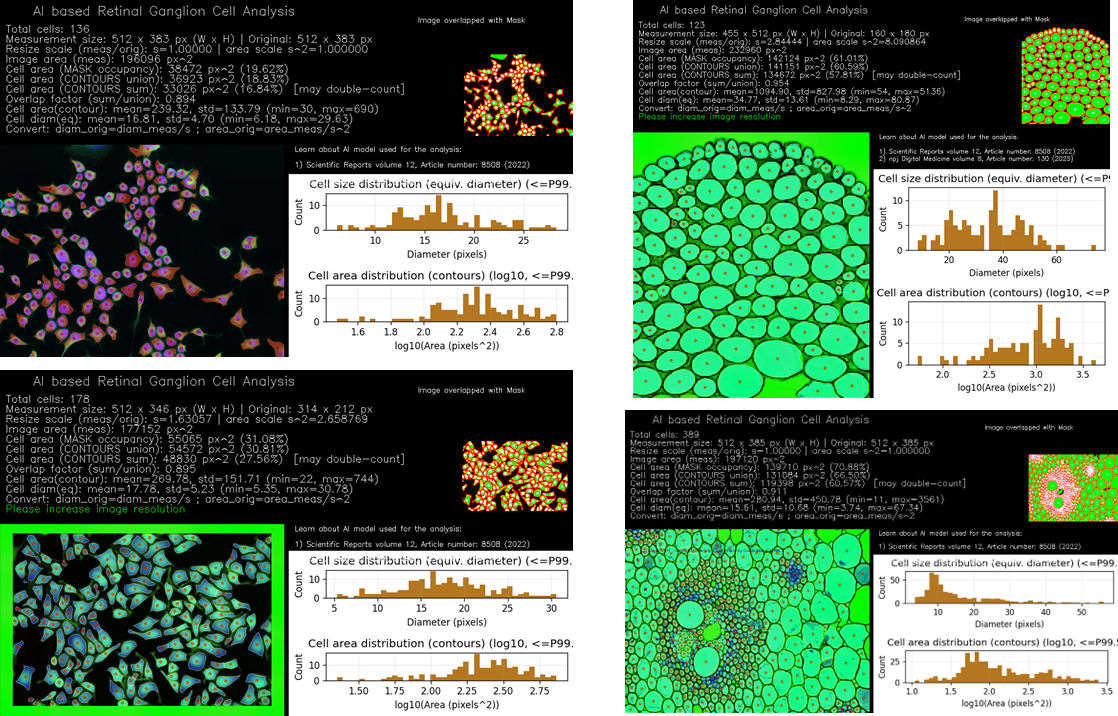
Output

Generates an analyzed image with quantitative information such as segmentation, counting, and size-related statistics.

This page is intended for research-oriented image analysis and quantitative exploration, not for clinical diagnosis or decision-making. Please upload only images that you are permitted to use.

Last updated: 16 March 2026
Upload image and run analysis
Supported use cases include fluorescence, optical, transmission and scanning electron microscope (TEM/SEM) images of cell-like structures, grains, particles, and microstructure images.
0.0s

How to use this page

The examples below illustrate the type of input images that work well and the kind of analysis output produced by the system.

Example Input
Example retinal image for RGC analysis

Upload a retinal microscopy image containing retinal ganglion cells (RGCs).

  • Fluorescence or immunostained microscopy images of mouse retinal tissue
  • Images with visible RGC somas or nuclei
  • Sufficient contrast between labeled RGCs and background tissue

Images should be reasonably focused with adequate contrast. Severely blurred or low-contrast images may affect detection accuracy.

Example Output
Example RGC detection and counting result

The output visualization provides:

  • Detected retinal ganglion cells highlighted on the image
  • Automated RGC counting results
  • Spatial distribution of detected RGCs within the field of view

Results are provided for research and quantitative analysis only. This demonstration is not intended for clinical diagnosis or decision-making.

Additional examples

These examples show broader use cases for materials science and medical or biological image analysis.

Materials Science
Materials Science

TEM image: AI-based grain size analysis of soft magnetic nanocrystalline FeSiBPCu ribbons showed a mean grain size of ~24 nm and a peak at 10–20 nm, consistent with Sharma et al. Competition driven nanocrystallization in high Bs and low coreloss Fe–Si–B–P–Cu soft magnetic alloys , Scripta Materialia, 95, 3–6 (2015).

General/Materials Science
Example image 2

SEM image: AI-based analysis of Opal (SiO2), showed a mean sphere size of ~211 nm, which is consistent with the size measured with Atomic Force Microscope (AFM) Gupta, Ganin, Sharma et al. Synthetic magnetic opals , Pramana - J Phys 58, 1051–1059 (2002).